Editors' Update - supporting editors, every step of the way.

非常抱歉,我们不完全支持您的浏览器。如果您可以选择,请升级到较新版本或使用 Mozilla Firefox、Microsoft Edge、Google Chrome 或 Safari 14 或更高版本。如果您无法进行此操作且需要支持,请将您的反馈发送给我们。
全新设计的官网为您带来全新体验,期待您的反馈 在新的选项卡/窗口中打开
2017年7月27日 | 3 分钟阅读
David Tucker
PlumX has been integrated into Elsevier’s leading products and services, enabling more researchers to access these comprehensive metrics
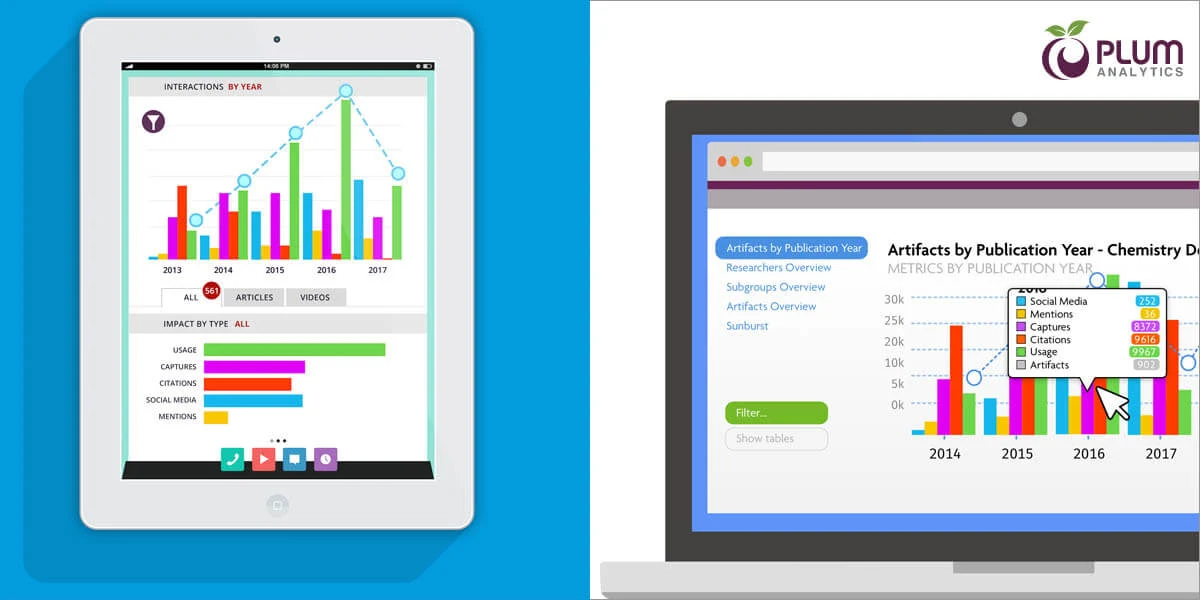
PlumX Metrics from Plum Analytics 在新的选项卡/窗口中打开 are now integrated into several Elsevier research products and our journal and society partner sites.
Scopus, Pure, Elsevier.com and Elsevier Journal Branded Solutions now benefit from PlumX Metrics, with ScienceDirect to follow.
“This exciting development means we are significantly expanding access to our metrics to more researchers and more institutions,” said Andrea Michalek, Managing Director of Plum Analytics. “Our aim is to help the academic community gain a deeper understanding of how their research is being used and communicated, and the impact it is having.
“A little over six months ago we joined Elsevier, and I’m delighted to have access to its global network and development resources to help us deliver our vision,” she added.
Elsevier acquired Plum Analytics in February. Its metrics help tell the story of research and researchers by revealing interest and usage beyond traditional measures.
PlumX gathers and brings together research metrics for all types of scholarly research output. It categorizes metrics into five groups:
Usage – a way to signal if anyone is reading the articles or otherwise using the research. Usage is the number one statistic researchers want to know after citations. Examples include clicks, downloads, views, library holdings and video plays.
Captures – indicate that someone wants to come back to the work. Captures can be a leading indicator of future citations. Examples include: bookmarks, code forks, favorites, readers and watchers.
Mentions – measure activities such as news articles or blog posts about research. They are a way to tell that people are truly engaging with the research. Examples include blog posts, comments, reviews, Wikipedia links and news media.
Social media – includes tweets, Facebook likes, etc., that reference the research. Social media can help measure “buzz” and attention; it can also be a good measure of how well a piece of research has been promoted. Examples include +1s, likes, shares and tweets.
Citations – include both traditional citation indexes such as Scopus as well as citations that help indicate societal impact, such as clinical or policy citations .Examples include citation indexes, patent citations, clinical citations and policy citations.
“People use PlumX Metrics in many ways. As funders require more narrative input on their applications and more recent and relevant information on the impact of research,” Michalek explained, “PlumX Metrics can help researchers in understanding what to emphasize in their grant applications. Publishers and editors also have a more complete understanding of what has been happening with articles they have published. Librarians can support faculty with tenure and promotion or funding applications by providing article-level metrics.”
PlumX Metrics have many advantages for individual researchers, librarians and institutions. These include:
Tracking 67 types of output, including books, book chapters and posters.
Tracking multiple versions of the same article – published, pre-print, green open access.
Categorizing metrics for clearer understanding and analysis.
Offering more sources of metrics than any other altmetrics provider.
Learn more on the Plum Analytics website 在新的选项卡/窗口中打开.

DT