Editors' Update - supporting editors, every step of the way.

Leider unterstützen wir Ihren Browser nicht vollständig. Wenn Sie die Möglichkeit dazu haben, nehmen Sie bitte ein Upgrade auf eine neuere Version vor oder verwenden Sie Mozilla Firefox, Microsoft Edge, Google Chrome oder Safari 14 bzw. eine neuere Version. Wenn Sie nicht dazu in der Lage sind und Unterstützung benötigen, senden Sie uns bitte Ihr Feedback.
Wir würden uns über Ihr Feedback zu diesen neuen Seiten freuen.Sagen Sie uns, was Sie denken Wird in neuem Tab/Fenster geöffnet
11. März 2015
Von Inez van Korlaar
Authors can view usage and citations in a single location
With competition for grant money and career opportunities on the rise, academics are under increasing pressure to demonstrate the impact of their work.
Elsevier has long offered CiteAlert, an email service notifying authors when their work is referenced in a newly published article on ScienceDirect Wird in neuem Tab/Fenster geöffnet. Then, in 2013, we launched Article Usage Reports, informing authors how often their articles have been accessed and by which countries.
Now, two departments* at Elsevier have joined forces to combine and improve on these initiatives which has led to the launch of the new My Research Dashboard. Any author who has published at least one article with Elsevier within the last 10 years will be eligible to register for a personalized dashboard, offering:
Early feedback on how their publications are being downloaded, shared and cited;
data about the geographic locations and research disciplines of readers;
detailed information about search terms used in ScienceDirect to find their publications; and
comparative data.
As My Research Dashboard is rolled out this year, the current Article Usage Reports and CiteAlert services will be phased out.
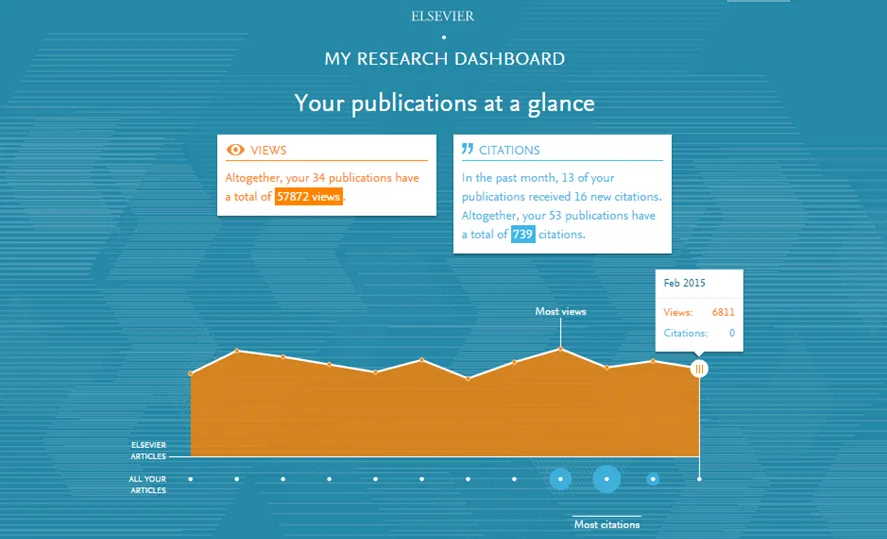
A personalized dashboard summary summarizing the performance of each publication. Published articles are listed alongside corresponding data on views (for Elsevier published articles) and citations (for all publications) in real-time.
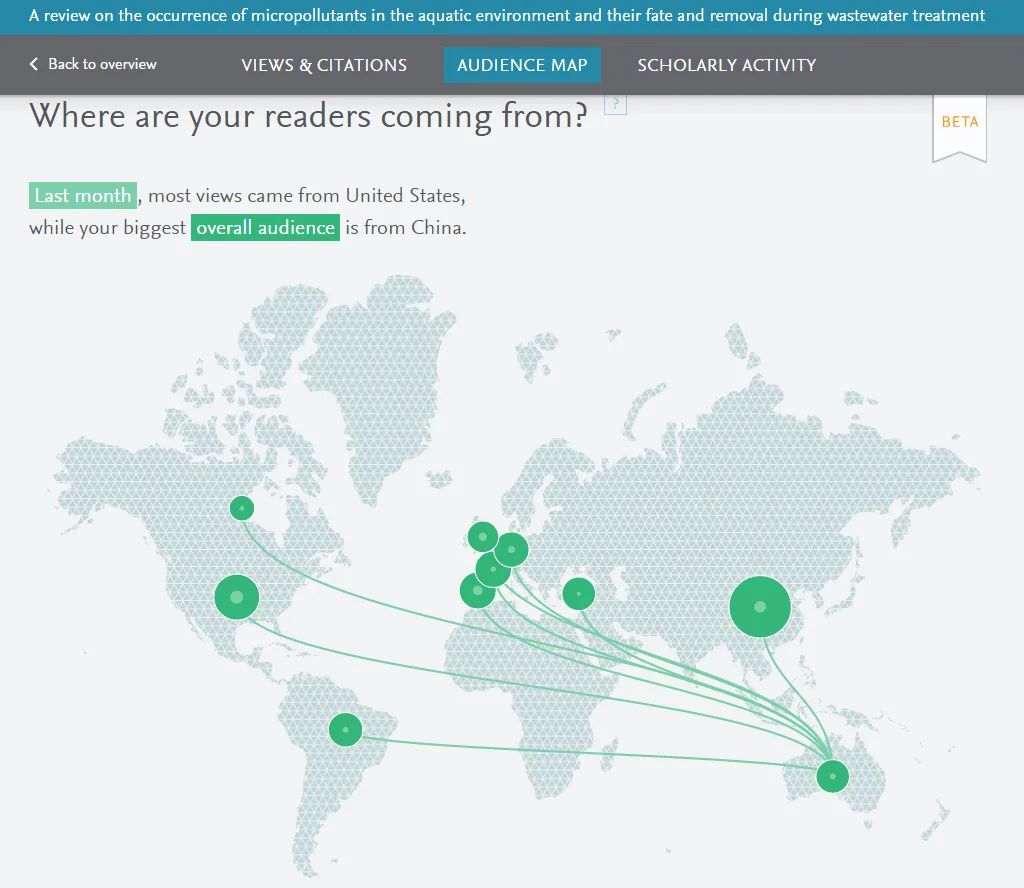
Audience and search terms. The Audience Map provides geographical and disciplinary readership analyses and information about where and how publications are being discovered.
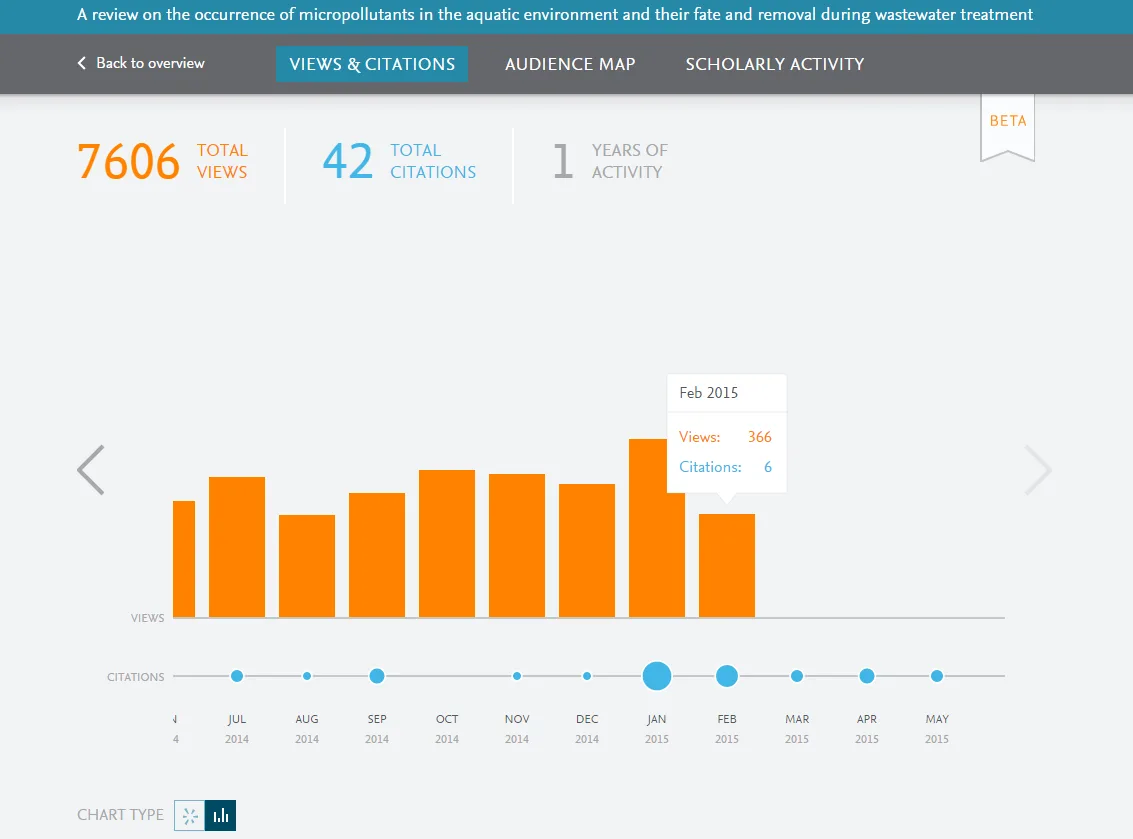
An overview of views and citations. It highlights how each individual publication is performing and includes a snapshot of the total number of views and citations received in the past month, as well as the total overall for that publication.
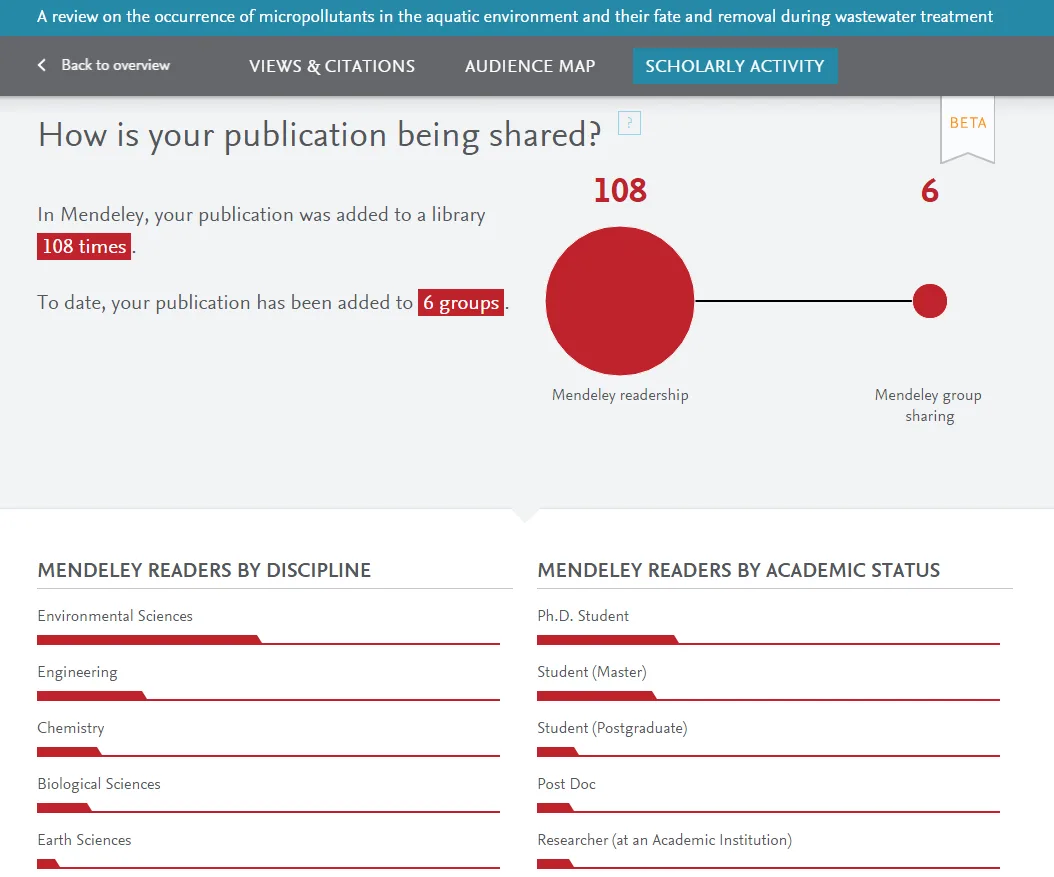
Scholarly activity. Sharing and showcasing usage metrics is expected to increase usage on the ScienceDirect and Scopus Wird in neuem Tab/Fenster geöffnet platforms, and to drive engagement with the research management and social collaboration platform Mendeley Wird in neuem Tab/Fenster geöffnet.
Over the course of 2015, authors will receive an invitation to register for their personalized My Research Dashboard, which they can do using their ScienceDirect / Scopus login details. Once registered, they will receive monthly updates when there are new usage or citation metrics to report on, although they will have access to their personal dashboard at any time using their password-protected login.
Any author who has published at least one article with Elsevier within the last 10 years will be invited to register for their dashboard. A soft launch was initiated in December 2014, when the Beta version was emailed to a group of 600 authors who were asked to register and provide feedback about their experiences. After using this feedback to further refine the dashboard, we began the rollout at the end of February 2015 – this will continue until all authors that have published with us have access to their personal dashboard.
Dashboards will be available for authors with at least one Elsevier publication since 2004.
Authors will be invited to register for their own personal dashboard.
Authors will receive monthly updates when there are new usage or citation metrics to report.
Metrics are gathered in real-time, meaning authors can check for updates whenever they want to.
Authors will be able to use their ScienceDirect / Scopus login details to gain access to their Dashboard.
Once the initiative has been fully rolled out, CiteAlert and Article Usage Reports will be discontinued.
Beta rollout began December 2014.
By the end of this year, most of our authors will have received a dashboard.
We believe that it's important to provide services to authors after they have published with us and to keep them informed about how their work in your journal is being received. In addition to strengthening our relationship, we hope this kind of enhanced publication-level metrics will encourage them to return to your journal with their next paper.
The following resources are available to help you communicate with your authors about My Research Dashboard and answer any questions they may have:
For more information contact: [email protected] Wird in neuem Tab/Fenster geöffnet
* My Research Dashboard is the result of the combined efforts of Elsevier's Research Applications & Platform (RAP) and STMJ’s Marketing Communications & Researcher Engagement (MCRED) teams. It supports Elsevier's mission to combine data from our platforms and create tools for researchers that help them be in control of information, make valuable connections and deliver higher quality research.

IVK